We have been talking about Business Intelligence and why we need it!! But for those who are reading this for the first time, let us have a look at the reasons.
With the coming of technology and increasing digitization of all the data, we have produced lots of digital data. This data is useful and can be used for making profits in the business. However, analyzing this data using traditional tools is quite difficult and we require a tool using which we can effectively analyze data and understand it to make better decisions.
So, the point is, we are working on a thing called, “data”. But, what is data and why is so much fuss about it?
WHAT IS DATA?
Data is a collection of facts with inter related characteristics or attributes. So, for example, collection of all the employees working in an organization is data. Collection of all the phone numbers of Airtel customers is data. Collection of the customer details who buy a particular product is data. And mind it, this data is important.
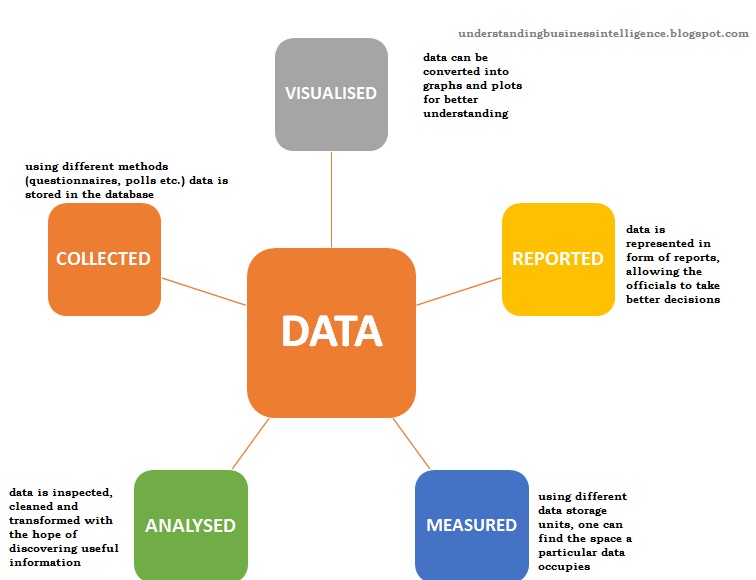
Okay, now the next big question is what we can do with data. Well, data can be –
- Collected – One can collect lots of data and then store it in the database, which can then be used for further operations. Now, how can you collect the data? Simple, the data can be collected using simple things like, questionnaires, quizzes, polls or reviews. Then there are records that are maintained by every organization about its employees, customers, their activities, preferences. All of these are data.
- Measured – Data can be measured using the data storage units i.e. bits, bytes, kilo bytes etc.
1 bit is the smallest unit of data in computer and is equal to 0.125 bytes.
1 byte is a group of 8 bits.
1 kilobyte is a group of 1024 bytes.
1 Megabyte is equal to 1024 Kilobytes
1 Gigabyte is equal to 1024 Megabyte
1 Terabyte is equal to 1024 Gigabyte.
1 Petabyte is equal to 1024 Terabyte.
The unit of data tells the amount of memory is uses for its storage.
- Analyzed – Data analysis refers to the process of inspecting, cleaning, transforming, and modeling data with the goal of discovering useful information, suggesting conclusions, and supporting decision-making. It is using the various Business Intelligence techniques that one can analyze data and use it for further decisions.
- Visualized – Data visualization refers to the communication of the information to the users clearly and efficiently using statistical graphics, plots, information graphics, tables, and charts selected.
- Reported– Once the data is analyzed and visualized, accurate reports need to be made of the data to ensure accurate analyses of the data by professionals.
Happy Learning 🙂

Leave a comment